

Don't trade.Let the market come to you.
The rich don't trade. They make their money work. Bring the token you already own, set the rate you'd sell at, and traders pay you the fee.
Launch. Trade. Earn.
Launch with a real market.
Same order book from day one. One price for every buyer.
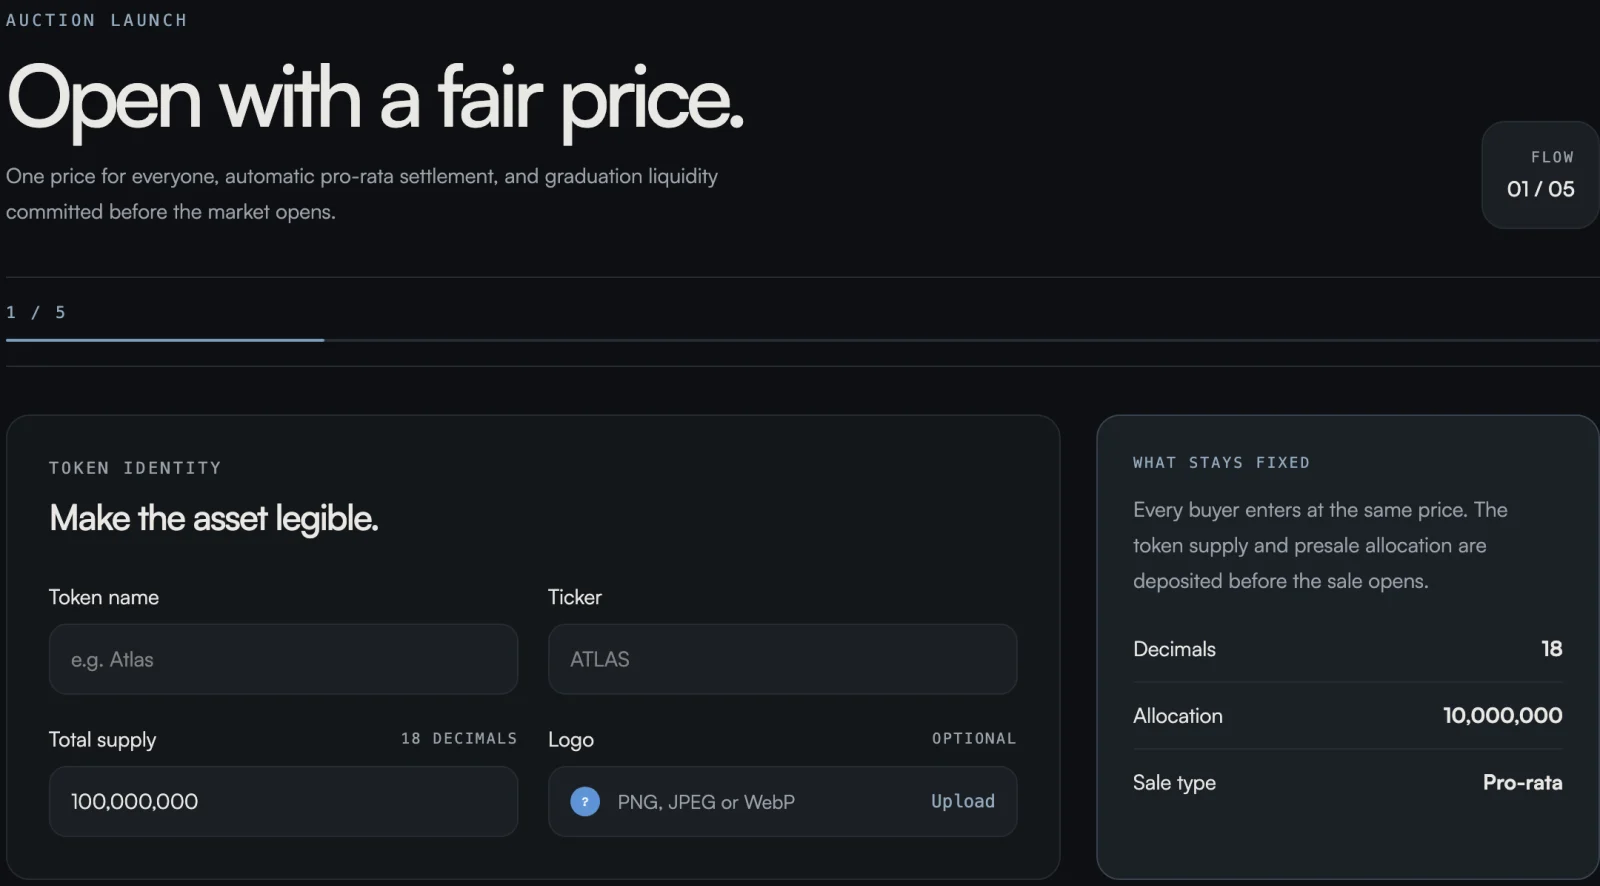
The curve picks your price. Size makes it worse.
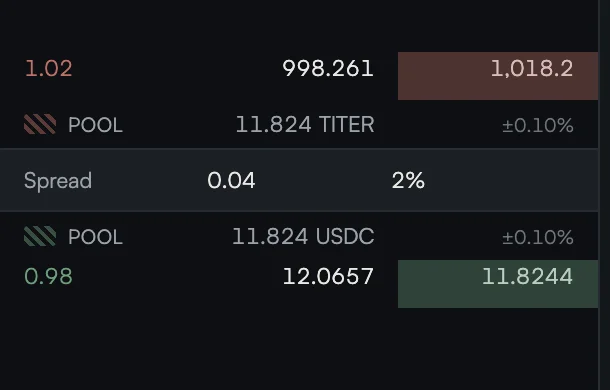
You name the price. LP liquidity rests on the same book.
Get paid to hold.
Deposit one token. Trades that fill against it pay you the fee.
Estimating from this pool's last 24 hours…
Don't lose on every trade.
Simulated results. Rerun every number yourself.
A large trade that loses up to 66% of its value to price impact on Uniswap v2 fills near its quoted price here. If the book can't fill you, your money comes back. No fake prices.
A sandwich attack that takes $500,000 from one trade on Uniswap v2 gets $2.55 here. After paying gas, the attacker loses money on every trade size.
Slippage by trade size
Percent of the trade lost to price impact, as the trade grows relative to book depth.
- Rate
- Uniswap v2
- Uniswap v3
- Curve
Trade size, as % of pool depth
View as table
| Trade size, as % of pool depth | Rate | Uniswap v2 | Uniswap v3 | Curve |
|---|---|---|---|---|
| 0.1% | 0.0% | 0.50% | 0.31% | 0.04% |
| 1% | 0.0% | 2.2% | 0.40% | 0.06% |
| 5% | 0.0% | 9.3% | 0.78% | 0.14% |
| 10% | 0.0% | 16.9% | 1.3% | 0.25% |
| 25% | 0.06% | 33.5% | 2.7% | 0.69% |
| 50% | 0.24% | 50.1% | 4.9% | 6.6% |
| 100% | 0.57% | 66.7% | 9.2% | 50.2% |
Sandwich profit by trade size
What an attacker nets sandwiching one trade, net of nothing but the trade itself.
- Rate
- Uniswap v2
- Uniswap v3
- Curve
Trade size, as % of pool depth
View as table
| Trade size, as % of pool depth | Rate | Uniswap v2 | Uniswap v3 | Curve |
|---|---|---|---|---|
| 1% | $0.00 | $5K | $0.00 | $4K |
| 5% | $0.00 | $40K | $4K | $30K |
| 10% | $0.00 | $85K | $31K | $73K |
| 30% | $0.30 | $265K | $187K | $266K |
| 60% | $2.55 | $540K | $450K | $564K |
LP loss when the market moves
Impermanent loss — how far a position ends up behind simply holding the two assets, once the price has moved — at Rate's widest tolerance vs. passive AMM liquidity.
- Rate
- Uniswap v2
- Uniswap v3
- Curve
Price move, as a multiple of the starting price
View as table
| Price move, as a multiple of the starting price | Rate | Uniswap v2 | Uniswap v3 | Curve |
|---|---|---|---|---|
| 0.5× | -0.00% | -5.7% | -32.5% | -28.9% |
| 0.8× | -0.00% | -0.62% | -9.1% | -8.3% |
| 0.95× | -0.00% | -0.03% | -0.67% | -1.3% |
| 1.05× | -0.00% | -0.03% | -0.61% | -1.2% |
| 1.25× | -0.00% | -0.62% | -8.6% | -8.3% |
| 2× | -0.00% | -5.7% | -30.7% | -28.9% |
| 5× | -0.00% | -25.5% | -64.7% | -62.2% |
Rate LPs still profit after the market moves 25%
A pool quotes a stale price until an arbitrageur takes the gap, wiping out Uniswap's and Curve's fees and leaving their LPs negative, while an Rate LP sets their own price — so the worst case is the price they chose, and profit holds even at +100%. CEX makers are counted at gross with inventory cost as zero, and the top tier still trails Rate's thinnest net.
LP net profit after price move, per $1M matched volume
View as table
| Venue | Gross | Loss when price moves | Net |
|---|---|---|---|
| Rate, thin market | $11K | -$12 | $11.0K |
| Rate, mid-depth | $3.1K | -$1 | $3.1K |
| Rate, deepest | $1.1K | -$0 | $1.1K |
| Rate, s = 0 (any depth) | $1K | $0 | $1K |
| Uniswap v2 | $3K | -$6.2K | -$3.2K |
| Uniswap v3 (0.30% tier) | $3K | -$85.5K | -$82.5K |
| Curve | $400 | -$83.2K | -$82.8K |
| CEX maker, top tier | $100–$600 | not modeled | $100–$600 |
| CEX maker, retail tier | -$1K to -$200 | not modeled | -$1K to -$200 |
Compare with data.
Every number on this page comes from the same simulation we use to build the product, not a highlight reel: every chart plots the full data grid, including the regimes where Rate doesn't win. We once caught a pricing bug of our own with it, one that was quietly losing money on the safest position, before it touched a dollar, and published that too. We do research in the open, fair and square.
How the fee is actually computedThese are the same three formulas behind the LP charts above, run on your own number instead of a fixed $1M example. Type in how much USDC you'd provide as liquidity and every figure below, and the chart, recomputes live — using the exact rates from the simulation, not rounded estimates.
This is not a yearly or daily rate. Every number below answers one question: once trading volume equal to your own liquidity has matched against it, one time, what fee did you earn? How often that happens in a real day depends on the pair and the market — that turnover rate isn't modeled here. If your liquidity gets matched twice a day, earn this amount twice a day; if it sits untraded, you earn nothing that day.
fee rate × your liquidity
0.30% flat
per matched turn, not per year
fee rate × your liquidity
0.04% flat
per matched turn, not per year
(spread margin + trader's taker fee) × your liquidity — you pay no fee
1% + 0.10%, thin market, top tier
per matched turn, not per year
Fee earned per matched turn, vs. liquidity provided
- Uniswap v2 / v3
- Curve
- Rate
Every line is a straight fee-rate-times-liquidity line; steeper means more fee per dollar deposited. The dashed marker is your current number above.
Liquidity provided (USDC)
Uniswap and Curve charge a protocol-fixed rate, same for every LP, every pair, regardless of how they quote. Rate's LP pays no fee at all — they earn the spread they quoted themselves, plus the fee the trader's own membership tier pays; the rate above is the top tolerance tier on a thin book, the same one behind the “Rate, thin market” row on the charts above. This assumes your liquidity gets matched dollar-for-dollar — real turnover varies by pair and venue, and it's the same simplifying assumption the net-of-price-risk chart above already uses. Open the LP charts above for every tier and book depth, not just this one.
One protocol. Your rate on every chain it runs on.
The same order book, the same launchpad and the same holder-first liquidity, deployed natively on each chain. One portfolio and one Explore view across all of them, and one profile that follows your wallet everywhere.
Mainnet is next.
Rate runs on testnet today. Each mainnet chain appears here the moment its contracts are deployed and verified.
Your chain needs a real market. Bring Rate to it.
- Built for real-world assets
- Quote at NAV with limit orders
- No curve slippage on size
- A launch venue for your ecosystem
A price that survives someone trying to move it.
Every trade here settles at a price averaged over real trading, not whatever happened in the last block. That price is a primitive other products can build on, not just a number shown to traders.
Lending
A lending market's liquidations are only as safe as the price that triggers them. A flash loan can move a single block's price; it can't move a ten-minute average.
Futures
A perpetual's mark price can read straight from this same book instead of a separate oracle, so the price that liquidates you is one a flash loan can't move.
Options
An option settles against whatever price is quoted at expiry. That price should survive someone trying to move it in the last block — this one does.
Stablecoins
A peg holds only as long as the price watching it can't be cheaply lied to. Read from a book that's already built to resist that.
Every product above needs the same thing: a price nobody can cheaply move. This book already is one.
Your agent can trade here.
Rate ships a Claude Code plugin. Install it and Claude can read the book, trade, provide liquidity, launch a coin or run an auction — with a wallet of its own and a spending limit you set. Under it is an MCP server, so any MCP client can use it too.
Run both inside Claude Code. Reads need no wallet at all, so the first run costs nothing and risks nothing.
The plugin on GitHub ↗Nothing to register and no credential to rotate. The chain checks a signature, so there is no account on Rate that could leak.
The agent generates a key for itself on your machine. It never touches the passkey wallet you sign with, and it holds only what you fund it with.
A policy file you own sets the limit per action and per day — $100 and $500 to start. It is re-read on every write, so an edit applies at once.
Every write returns a preview first: the action, the amounts, each approval. Nothing moves until a second call sends it.
Testnets work out of the box. Any other chain has to be added to the policy file by hand — the cap is yours, and nothing raises it for you.
Don't trade. Let an agent wait for your rate.
Most bots are built to trade more. This one is built to trade less. You pick a price. It waits. If the price never comes, it never trades. It never holds your money — it can only do the things you signed for.
You set the limits first
Which pairs it may touch, how much per order, how much at once, how far the price may slip, how often it may act, and when it must stop.
Every result shows its work
Open any trade and see what it planned, what it sent, what filled, and what it cost. Nothing is summarised for you.
Doing nothing is the default
No price, no trade. It cannot raise its own limits, move your money, or hide a refusal. You can stop it at any time.
Test a frozen strategy against live Rate market data. No wallet authority and no assets at risk.
Make your money work. Let the traders pay you.
And when you do move, move at your rate: every fill on an open onchain book, at a price you chose.